
|
Getting your Trinity Audio player ready…
|
In this post, I provide LaTeX templates for figures, tables, and equations by sharing content from a few chapters of my Ph.D. thesis. I hope this helps you to write your thesis! Template for a figure, group of figures, figures using subfloat, tables, and equations are provided below!
To use LaTeX to typeset your thesis, you need a LaTeX editor.
There are various editors you can easily download online.
I use TeXShop. It’s free.
You can copy the lines from the LaTeX template below and paste them into a new document in the LaTeX editor.
Make changes such as the filename of the figure.
And then compile and run the code which on TeXShop is as simple as hitting the “Typeset” button.
Tell me how it goes in the comments below!
And do not hesitate to ask any questions – happy writing!
LaTeX templates for figures, tables, and equations are below.
LaTeX template for figures
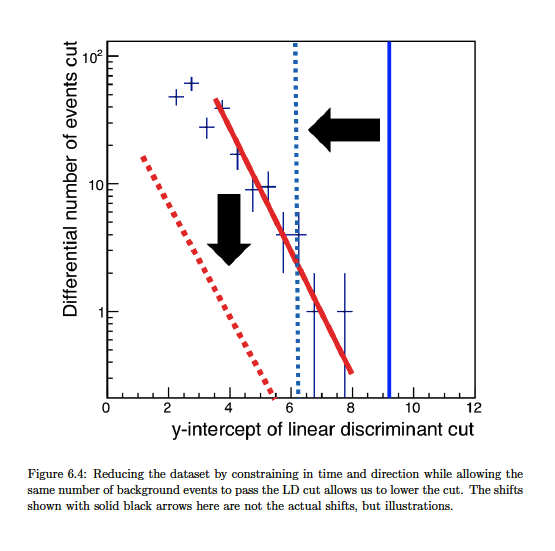
begin{figure}
centering
includegraphics[width=0.9textwidth]
{figures/reduced_ld.png}
caption{Reducing the dataset by constraining in time and direction while allowing the same number of background events to pass the LD cut allows us to lower the cut. The shifts shown with solid black arrows here are not the actual shifts, but illustrations.}
label{reduced_ld}
end{figure}
LaTeX template for table
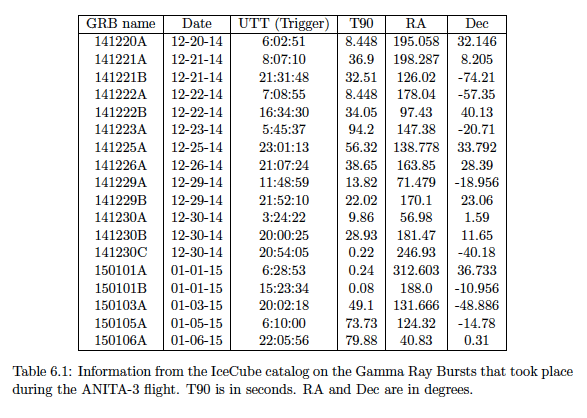
begin{table}
centering
begin{tabular}{ |c|c|c|c|c|c| }
hline
GRB name & Date & UTT (Trigger) & T90 & RA & Dec\
hline
141220A& 12-20-14  & 6:02:51   & 8.448& 195.058 & 32.146\
141221A& 12-21-14& 8:07:10   & 36.9& 198.287 & 8.205\
141221B& 12-21-14& 21:31:48& 32.51& 126.02  &-74.21\
141222A& 12-22-14& 7:08:55& 8.448& 178.04  &-57.35\
141222B& 12-22-14& 16:34:30& 34.05& 97.43  & 40.13\
141223A& 12-23-14& 5:45:37& 94.2& 147.38  &-20.71\
141225A& 12-25-14& 23:01:13& 56.32& 138.778 &33.792\
141226A& 12-26-14& 21:07:24& 38.65& 163.85  &28.39\
141229A& 12-29-14& 11:48:59& 13.82& 71.479  &-18.956\
141229B& 12-29-14& 21:52:10& 22.02& 170.1  & 23.06\
141230A& 12-30-14& 3:24:22& 9.86& 56.98  & 1.59\
141230B& 12-30-14& 20:00:25& 28.93& 181.47  &11.65\
141230C& 12-30-14& 20:54:05& 0.22& 246.93  &-40.18\
150101A& 01-01-15& 6:28:53& 0.24& 312.603 &36.733\
150101B& 01-01-15& 15:23:34& 0.08& 188.0  & -10.956\
150103A& 01-03-15& 20:02:18& 49.1& 131.666 &-48.886\
150105A& 01-05-15& 6:10:00& 73.73& 124.32  &-14.78\
150106A& 01-06-15& 22:05:56& 79.88& 40.83  & 0.31\
hline
end{tabular}
caption{Information from the IceCube catalog on the Gamma Ray Bursts that took place during the ANITA-3 flight. T90 is in seconds. RA and Dec are in degrees.}
label{catalog}
end{table}
LaTeX template for equation 1
begin{equation}
cut_{old} - cut_{new} = frac{1}{b}ln F
label{factor}
end{equation}

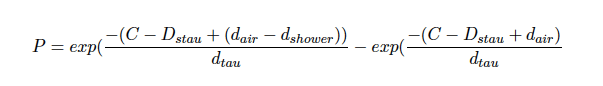
LaTeX template for equation 2
begin{equation*}
P = exp( frac{-(C - D_{stau} + (d_{air} - d_{shower}))}{d_{tau}}
- exp( frac{-(C - D_{stau} + d_{air})}{d_{tau}}
label{stau_integral}
end{equation*}
LaTeX template for a group of figures
begin{figure}
centering
includegraphics[width]=.49textwidth]{figures/source_test_using_nnu-100.png}
includegraphics[width]=.49textwidth]{figures/source_test_using_nnu100.png}
includegraphics[width]=.49textwidth]{figures/source_test_using_nnu100_time_cut_6hrs.png}
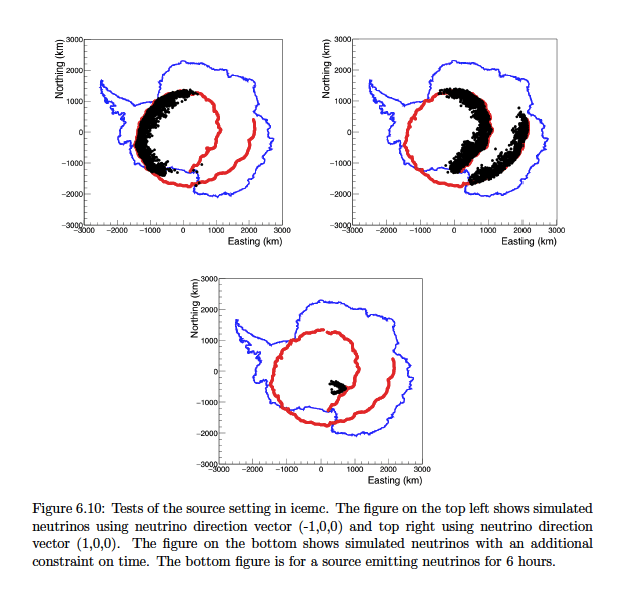
caption{Tests of..}
label{sources_tests}
end{figure}
LaTeX template for Figures using subfloat
begin{figure}
centering
subfloat[ANITA-2 simulated neutrinos showing sensitivity in different bins]
{ includegraphics[width=0.72 textwidth]{figures/healPixMapSimFinal.png}
label{anita2bins} }
par
subfloat[ANITA-3 10% data showing noise levels in different bins]
{ includegraphics[width=0.72 textwidth]{figures/binned.png}
label{anita3bins} }
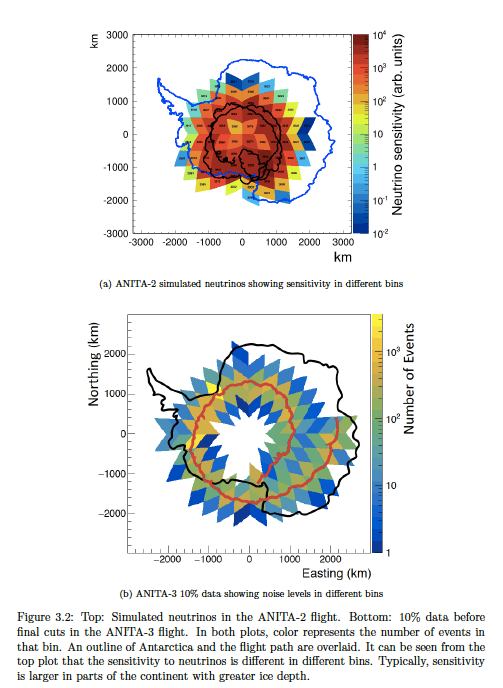
caption{Top: Simulated neutrinos in the ANITA-2 flight. Bottom: 10% data before final cuts in the ANITA-3 flight. In both plots, color represents the number of events in that bin. An outline of Antarctica and the flight path are overlaid. It can be seen from the top plot that the sensitivity to neutrinos is different in different bins. Typically, sensitivity is larger in parts of the continent with greater ice depth.}
label{bins}
end{figure}
Note the mini sub-captions that are possible with this option!
What LaTeX problems are you having? Please feel free to share them below!
Before you go…
The “How to PhD” blog and book
If you are feeling overwhelmed or stuck in graduate school, you are not alone. You can get help to navigate those situations both in this blog and in the book. It is packaged more efficiently in the book, of course, which is why people have found it worthwhile to just get the book. The information is presented step-by-step there and in an organized manner.
Having said that, I am not trying to push you to buy the book. I am perfectly happy if you just read the blog, too! I want you to succeed and to know your options for getting maximum support during graduate school and after. That is my ultimate goal.
Follow me on Twitter!
![]()
Leave a Reply